DATI SINTETICI SUL POSIZIONAMENTO DELL’ITALIA NEL MONDO
Non siamo gli ultimi, non siamo i primi
comunque siamo tra i primi nel mondo
e abbiamo enormi potenzialita non espresse
THE WORLD’S TOP COUNTRIES FOR TOURISM – OCTOBER 1, 2018

Map: The World’s Top Countries for Tourism – Top 15 International Destinations – Data from HowMuch.net resizes countries around the world based on international tourist receipts in 2017, using data from the World Tourism Organization.
| Rank | Country | International Visitors | Dollars Spent |
| #1 | United States | 74.7 million | $210.7B |
| #2 | Spain | 81.8 million | $68.0B |
| #3 | France | 86.9 million | $60.7B |
| #4 | Thailand | 35.4 million | $57.5B |
| #5 | United Kingdom | 37.6 million | $51.2B |
| #6 | Italy | 58.3 million | $44.2B |
| #7 | Australia | 8.9 million | $41.7B |
| #8 | Germany | 37.5 million | $39.8B |
| #9 | Macao (China) | 17.3 million | $35.6B |
| #10 | Japan | 28.7 million | $34.1B |
| #11 | Hong Kong (China) | 27.9 million | $33.3B |
| #12 | China | 60.7 million | $32.6B |
| #13 | India | 15.5 million | $27.4B |
| #14 | Turkey | 37.6 million | $22.5B |
| #15 | Mexico | 39.3 million | $21.3B |
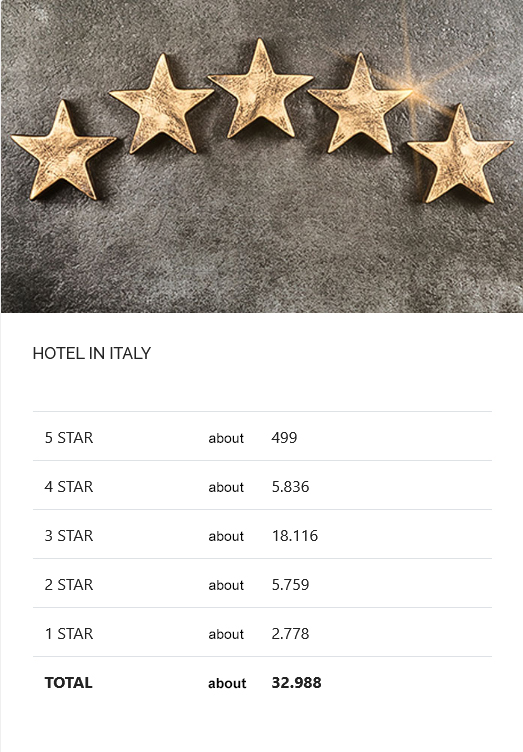
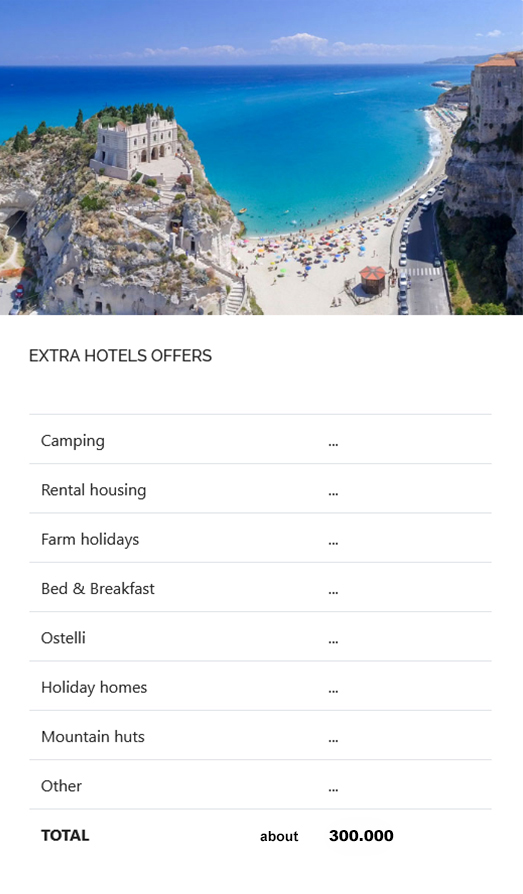
IL COMPARTO ALBERGHIERO IN ITALIA
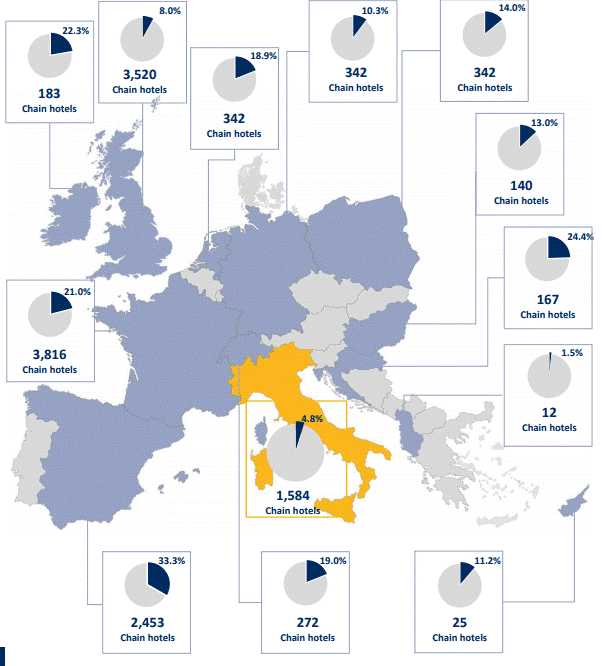
ITALIA: CAMERE HOTEL
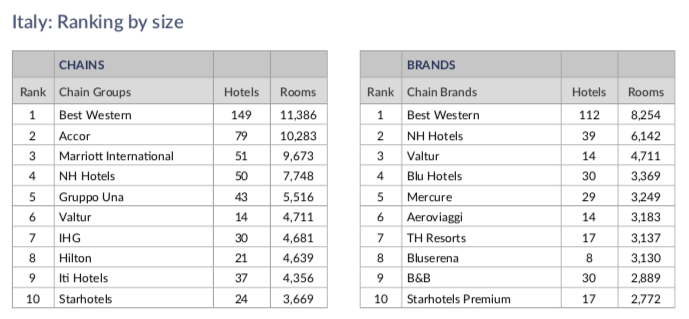
Fonte: Horwath Htl 2018.
CATENE ALBERGHIERE IN ITALIA E IN EUROPA
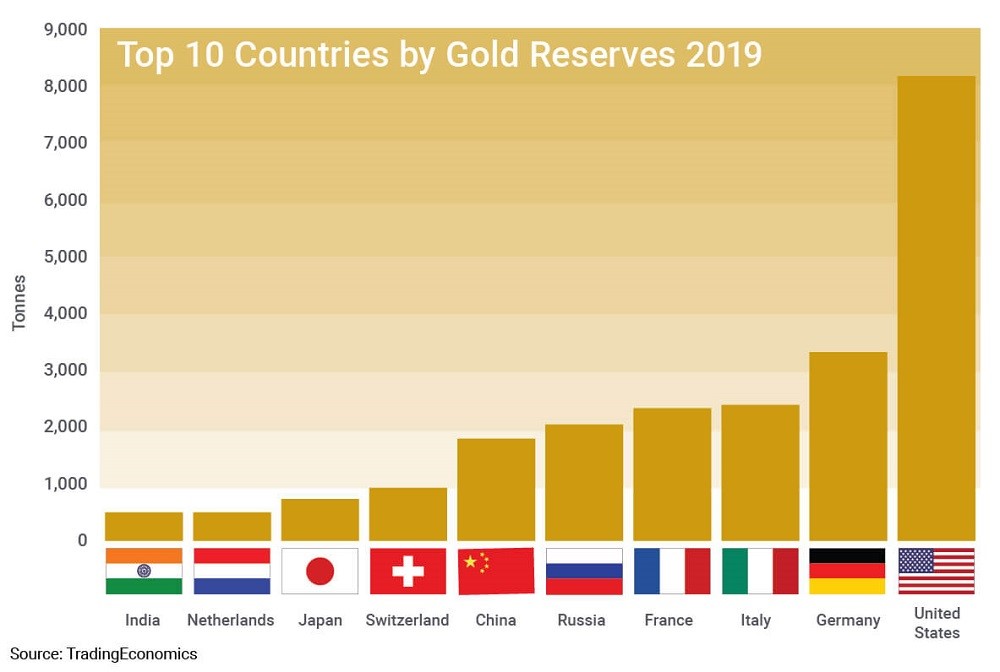
RISERVE AUREE PER PAESE – GOLD RESERVES BY COUNTRY
Bankitalia è il quarto detentore mondiale di oro, con 2.452 tonnellate 12 FEBBRAIO 2019

THE RICHEST COUNTRIES IN THE WORLD PUBLISHED MAY 24, 2019
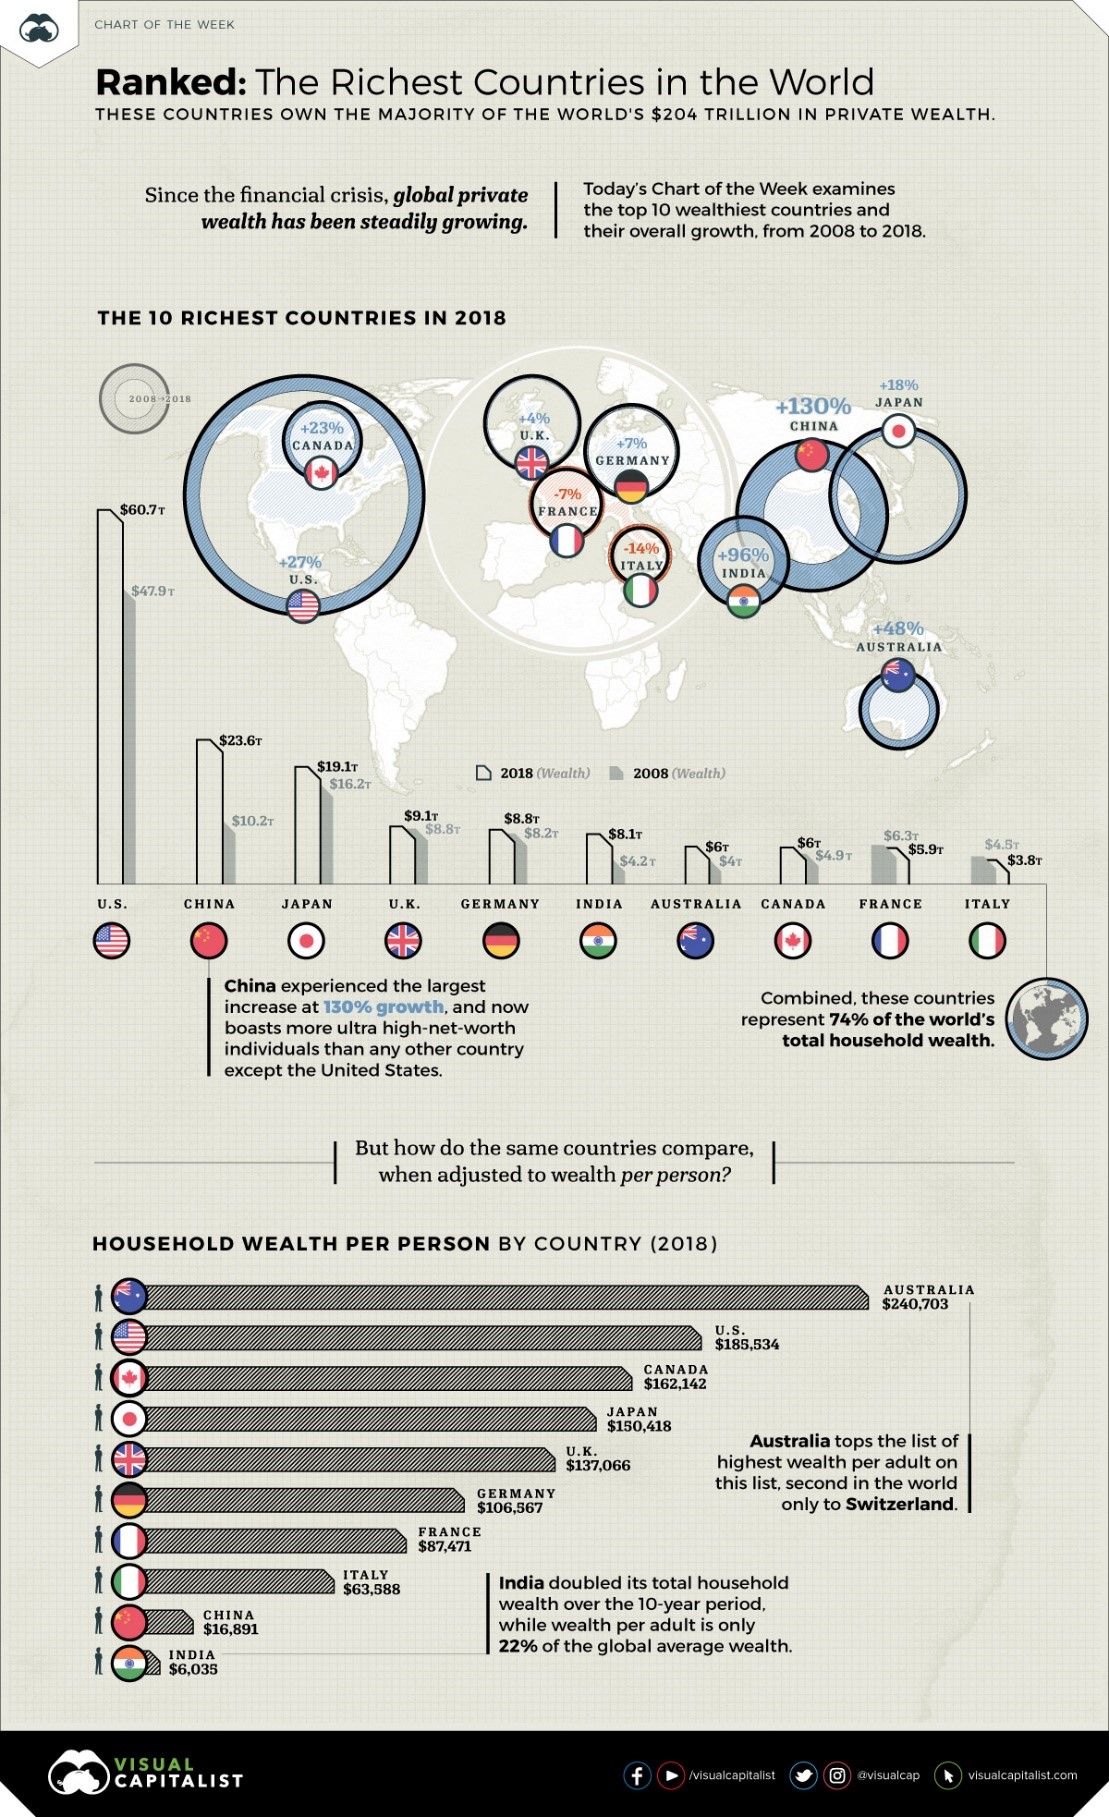
Ranked: The Richest Countries in the World – Numbers from the Global Wealth Migration Review 2019.
| Rank | Country | Private Wealth in $USD (2018) | 10-yr change (%) |
| #1 | United States | $60.7 trillion | 27% |
| #2 | China | $23.6 trillion | 130% |
| #3 | Japan | $19.1 trillion | 18% |
| #4 | United Kingdom | $9.1 trillion | 4% |
| #5 | Germany | $8.8 trillion | 7% |
| #6 | India | $8.1 trillion | 96% |
| #7 | Australia | $6.0 trillion | 48% |
| #8 | Canada | $6.0 trillion | 23% |
| #9 | France | $5.9 trillion | -7% |
| #10 | Italy | $3.8 trillion | -14% |
VISUALIZING THE WEALTH OF NATIONS – JULY 4, 2019
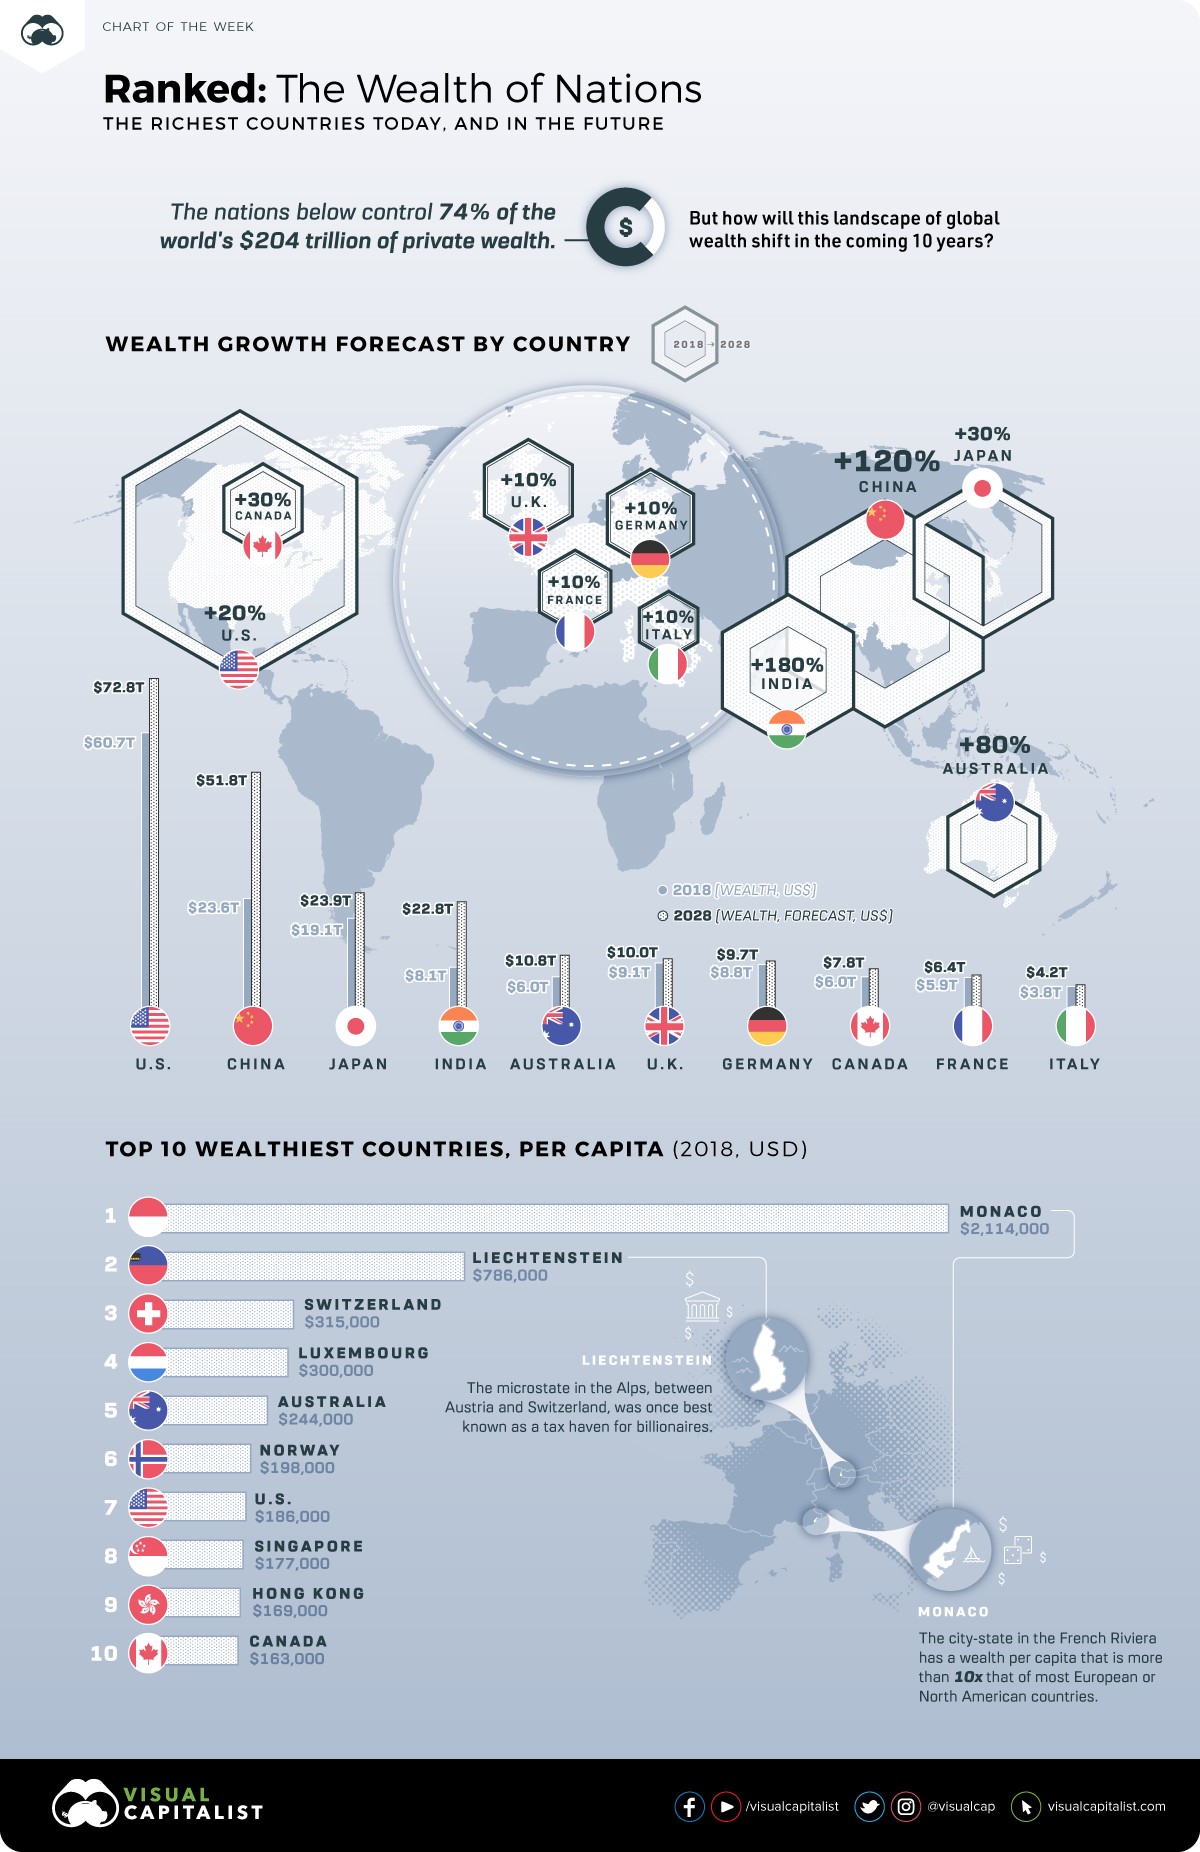
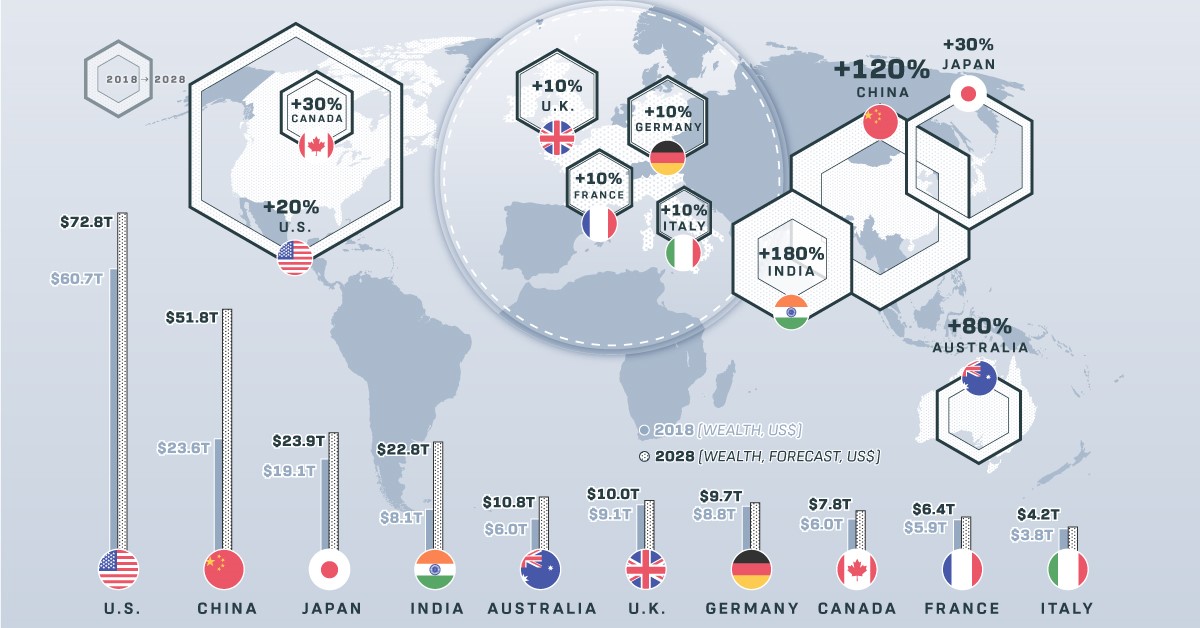
“Wherever there is great property, there is great inequality.” – Adam Smith, The Wealth of Nations.
10 wealthiest nations both now and as forecasted in 2028 = Data from the Global Wealth Migration Review
| Rank | Country | Wealth (2018) | Wealth (2028F) | Approx. Growth |
| #1 | United States | $60.7 trillion | $72.8 trillion | 20% |
| #2 | China | $23.6 trillion | $51.8 trillion | 120% |
| #3 | Japan | $19.1 trillion | $24.9 trillion | 30% |
| #4 | India | $8.1 trillion | $22.8 trillion | 180% |
| #5 | Australia | $6.0 trillion | $10.8 trillion | 80% |
| #6 | United Kingdom | $9.1 trillion | $10.0 trillion | 10% |
| #7 | Germany | $8.8 trillion | $9.7 trillion | 10% |
| #8 | Canada | $6.0 trillion | $7.8 trillion | 30% |
| #9 | France | $5.9 trillion | $6.4 trillion | 10% |
| #10 | Italy | $3.8 trillion | $4.2 trillion | 10% |
MAPPED: THE WORLD’S LARGEST EXPORTERS IN 2018 PUBLISHED OCTOBER 3, 2019
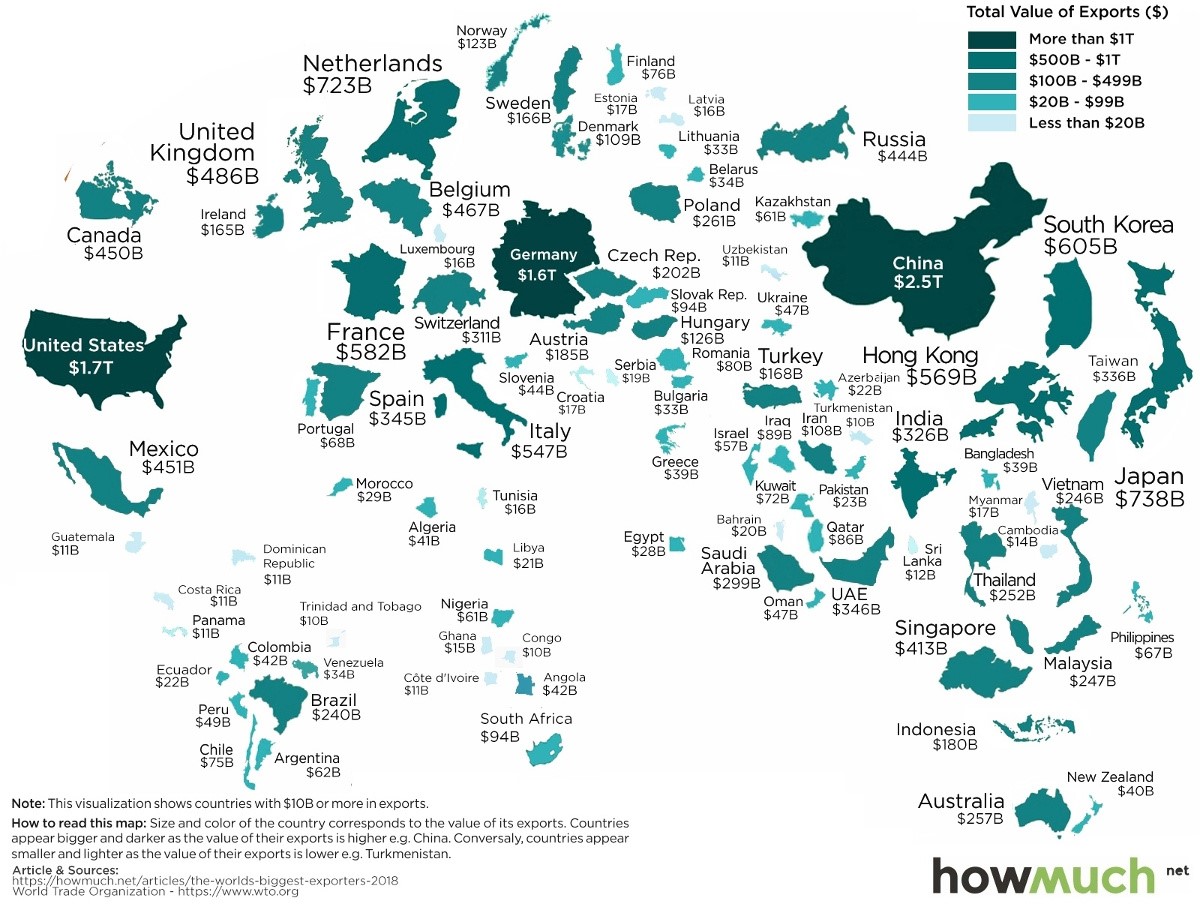
Visualizing the World’s Largest Exporters in 2018 – Ranked: The 15 Largest Exporters in 2018 – Data from HowMuch.net, and it resizes countries based on their most recent export numbers, as per data from the World Trade Organization (WTO)
| Rank | Country | Exports (2018, $M) | Share of Global Total |
| #1 | China | $2,487,045 | 12.8% |
| #2 | United States | $1,664,085 | 8.6% |
| #3 | Germany | $1,560,816 | 8.0% |
| #4 | Japan | $738,403 | 3.8% |
| #5 | Netherlands | $722,668 | 3.7% |
| #6 | Korea, Rep. | $604,860 | 3.1% |
| #7 | France | $581,816 | 3.0% |
| #8 | Hong Kong, China | $569,241 | 2.9% |
| #9 | Italy | $546,643 | 2.8% |
| #10 | United Kingdom | $485,711 | 2.5% |
| #11 | Belgium | $466,724 | 2.4% |
| #12 | Mexico | $450,572 | 2.3% |
| #13 | Canada | $449,845 | 2.3% |
| #14 | Russia | $444,008 | 2.3% |
| #15 | Singapore | $412,629 | 2.1% |
MAPPED: TOP COUNTRIES BY TOURIST SPENDING PUBLISHED OCTOBER 10, 2019
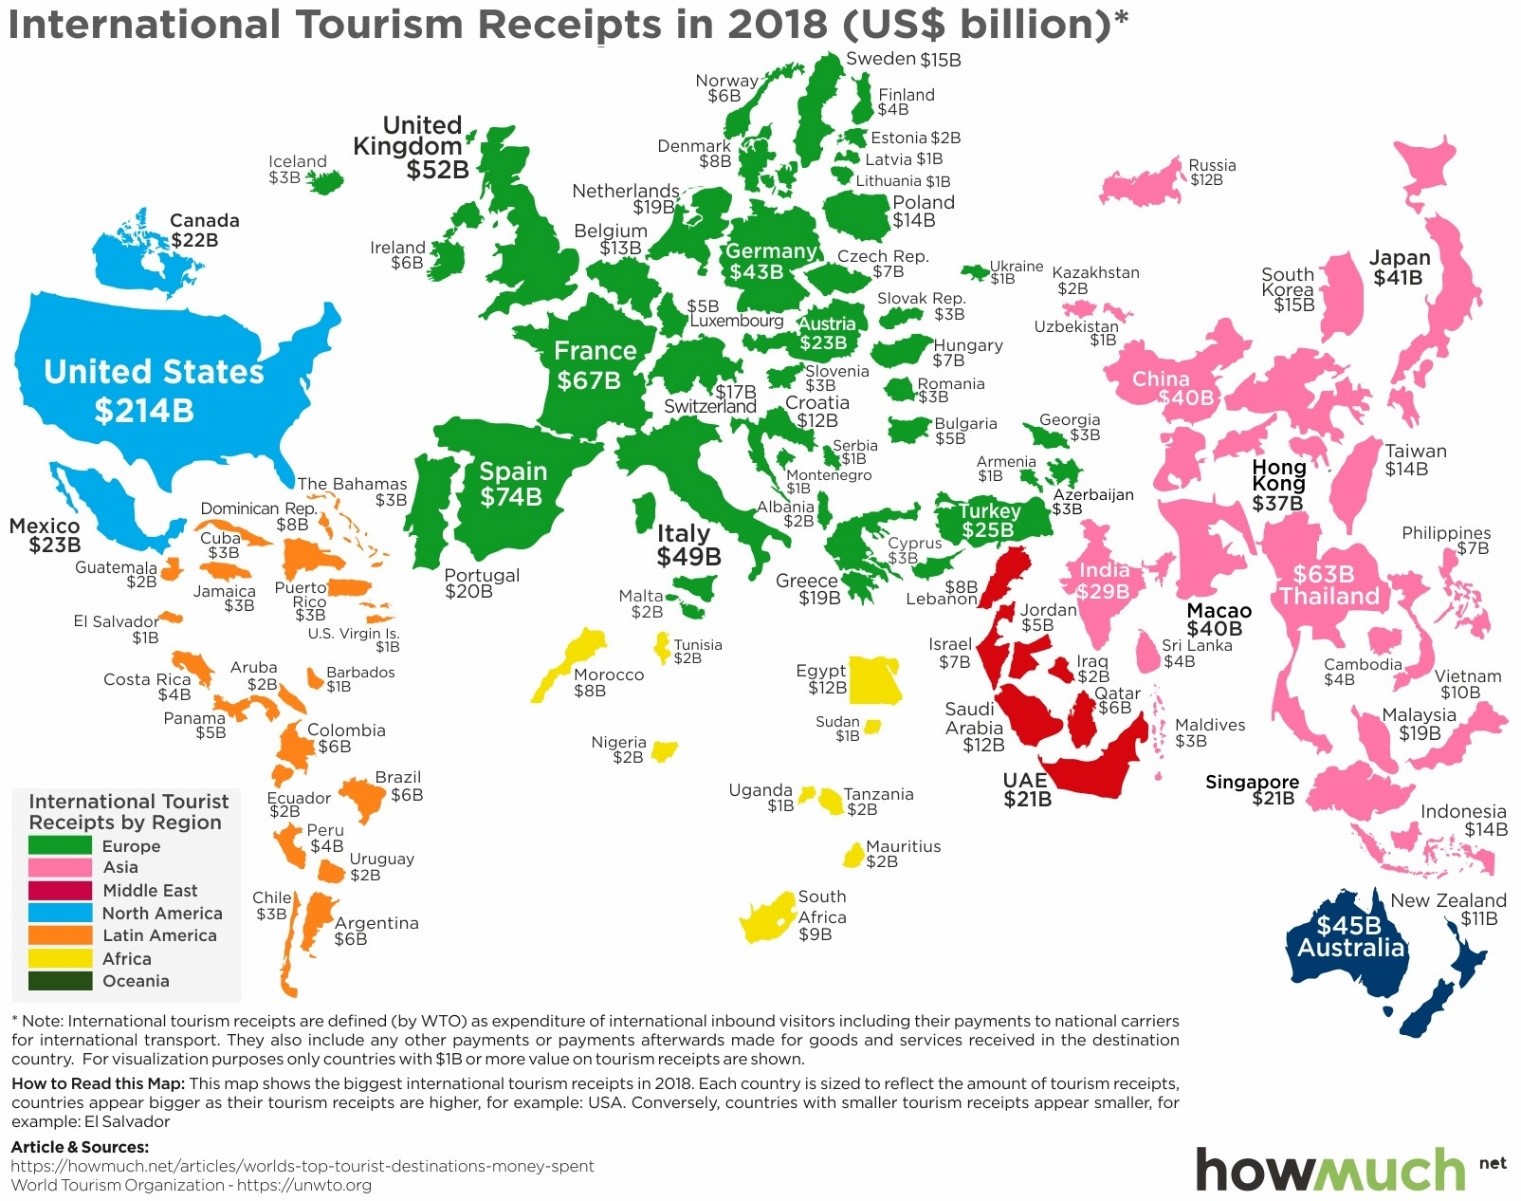
The Top Tourist Hotspots, By Country – Source: World Tourism Organization (UNWTO). Note that data is for international tourism only and does not include domestic tourism.
| Country | 2018 Spending | 2018 Arrivals | Country | 2017 Spending | 2017 Arrivals |
| 1. U.S. | $214.5B | 79.6M | 1. U.S. | $210.7B | 74.8M |
| 2. Spain | $73.8B | 82.8M | 2. Spain | $68B | 81.8M |
| 2. France | $67.4B | 89.4M | 3. France | $60.7B | 86.9M |
| 4. Thailand | $63B | 38.3M | 4. Thailand | $57.5B | 35.4M |
| 5. UK | $51.9B | 36.3M | 5. UK | 51.2B | 37.7M |
| 6. Italy | $49.3B | 62.1M | 6. Italy | $44.2B | 58.3M |
| 7. Australia | $45B | 9.2M | 7. Australia | $41.7B | 8.8M |
| 8. Germany | $43B | 38.9M | 8. Germany | $39.8B | 37.5M |
| 9. Japan | $41.1B | 31.2M | 9. Macao (SAR) | $35.6B | 17M |
| 10. China | $40.4B | 62.9M | 10. Japan | $34.1B | 28.6M |
COUNTRIES RANKED BY THEIR ECONOMIC COMPLEXITY PUBLISHED 1 NOVEMBER 20, 2019
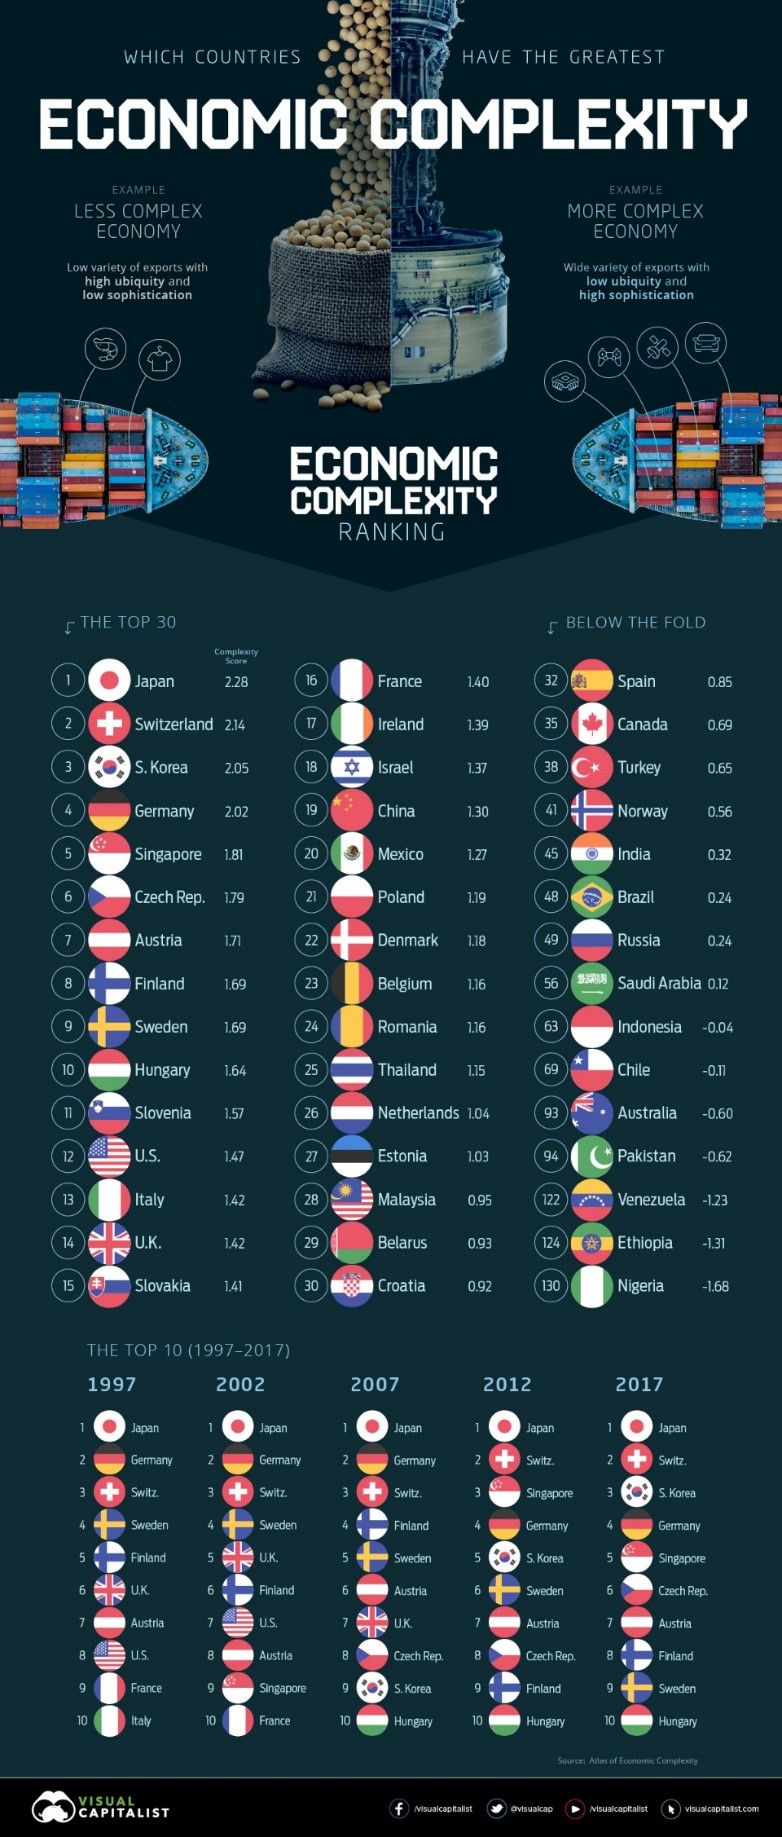
Countries Ranked by Their Economic Complexity created the Country Complexity Ranking.
| Rank | Country | Score | Top Export(s) |
| 1 | Japan | 2.28 | Cars |
| 2 | Switzerland | 2.14 | ICT (tech) |
| 3 | South Korea | 2.05 | ICT, cars |
| 4 | Germany | 2.02 | Integrated circuits |
| 5 | Singapore | 1.81 | ICT, cars |
| 6 | Czech Rep. | 1.79 | Cars |
| 7 | Austria | 1.71 | ICT, tourism |
| 8 | Finland | 1.69 | ICT |
| 9 | Sweden | 1.67 | ICT |
| 10 | Hungary | 1.64 | ICT, cars |
MARKETS ALL OF THE WORLD’S WEALTH IN ONE VISUALIZATION PUBLISHED JANUARY 16, 2020
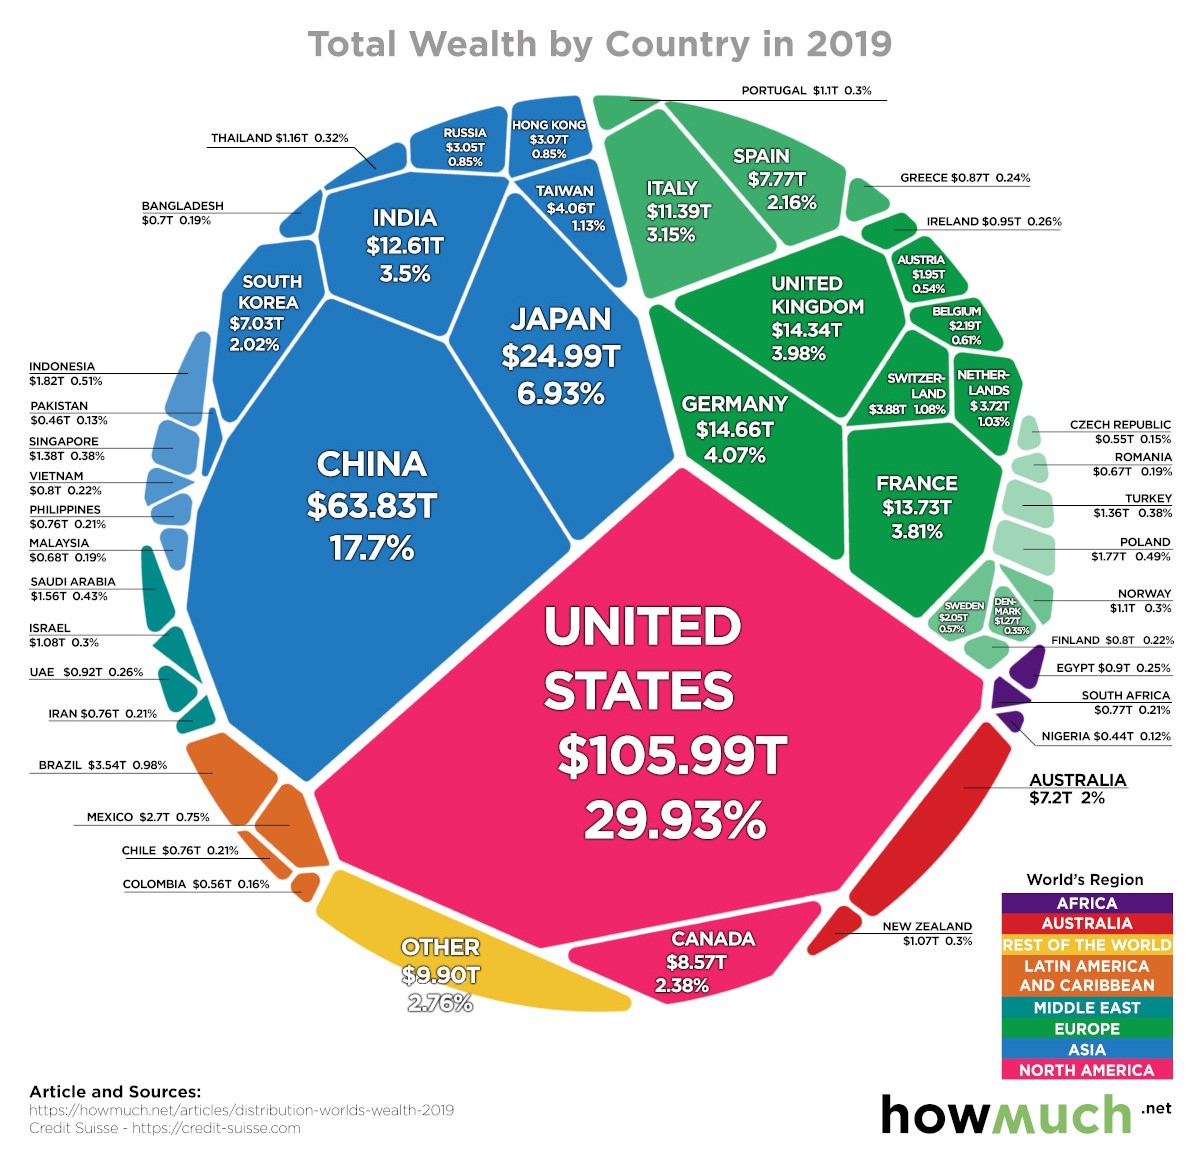
Ranking Countries by Total Wealth
| Rank | Country | Region | Total Wealth ($B, 2019) | % Global Share |
| Global Total | $360,603 | 100.0% | ||
| #1 | United States | North America | $105,990 | 29.4% |
| #2 | China | China | $63,827 | 17.7% |
| #3 | Japan | Asia-Pacific | $24,992 | 6.9% |
| #4 | Germany | Europe | $14,660 | 4.1% |
| #5 | United Kingdom | Europe | $14,341 | 4.0% |
| #6 | France | Europe | $13,729 | 3.8% |
| #7 | India | India | $12,614 | 3.5% |
| #8 | Italy | Europe | $11,358 | 3.1% |
| #9 | Canada | North America | $8,573 | 2.4% |
| #10 | Spain | Europe | $7,772 | 2.2% |
| #11 | South Korea | Asia-Pacific | $7,302 | 2.0% |
| #12 | Australia | Asia-Pacific | $7,202 | 2.0% |
| #13 | Taiwan | Asia-Pacific | $4,062 | 1.1% |
| #14 | Switzerland | Europe | $3,877 | 1.1% |
| #15 | Netherlands | Europe | $3,719 | 1.0% |
| All Other Countries | $56,585 | 15.7% |
THE $88 TRILLION WORLD ECONOMY IN ONE CHART PUBLISHED SEPTEMBER 14, 2020
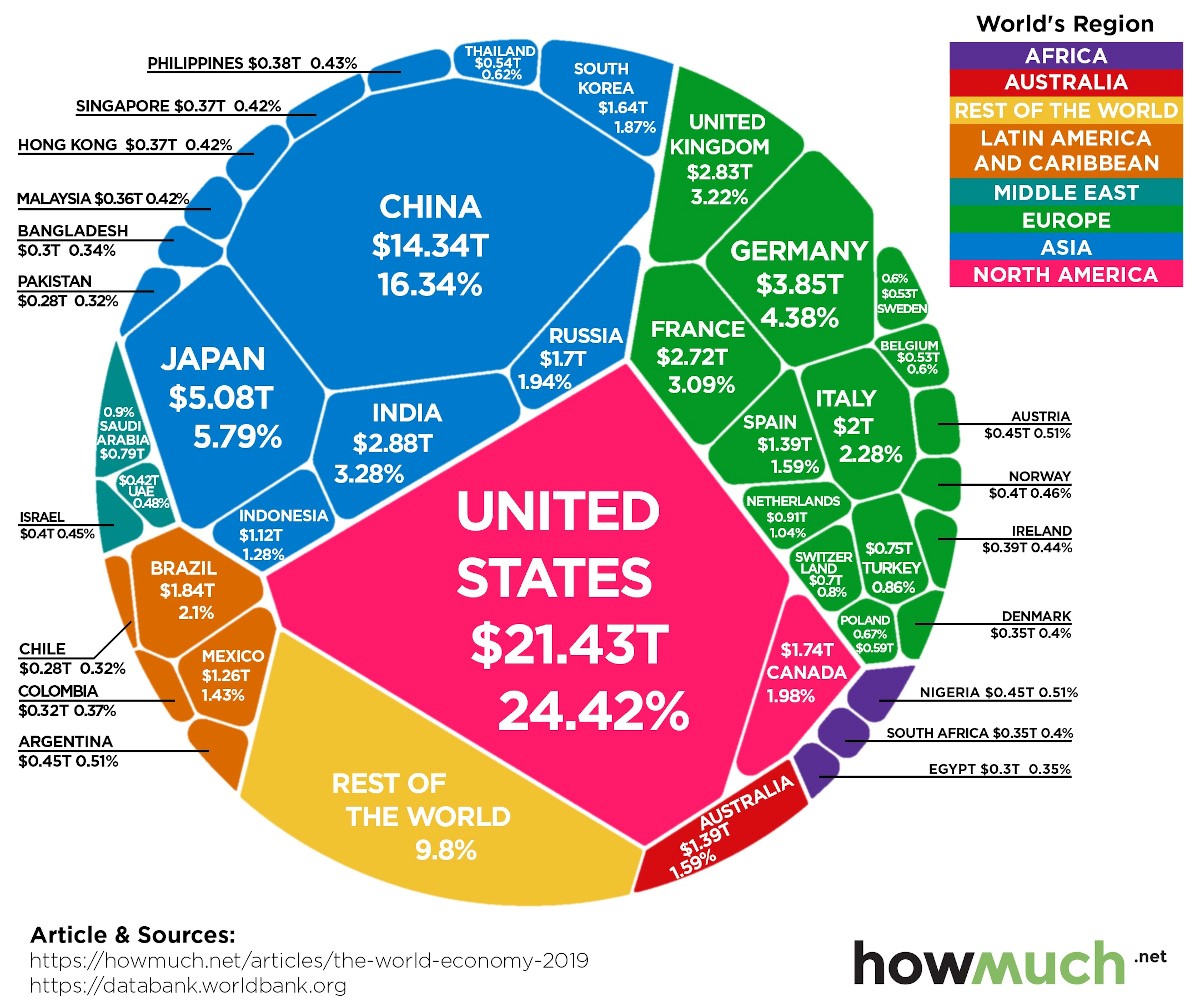
The $88 Trillion World Economy in One Chart Top 10 Countries by GDP (2019) Source: World Bank Global Economic Prospects, released June 2020
| Rank | Country | GDP | % of Global GDP |
| #1 | U.S. | $21.4T | 24.4% |
| #2 | China | $14.3T | 16.3% |
| #3 | Japan | $5.1T | 5.8% |
| #4 | Germany | $3.9T | 4.4% |
| #5 | India | $2.9T | 3.3% |
| #6 | UK | $2.8T | 3.2% |
| #7 | France | $2.7T | 3.1% |
| #8 | Italy | $2.0T | 2.3% |
| #9 | Brazil | $1.8T | 2.1% |
| #10 | Canada | $1.7T | 2.0% |
| Top 10 Countries | $58.7 trillion | 66.9% |
WHICH COUNTRIES HAVE THE MOST WEALTH PER CAPITA? AUGUST 16, 2019
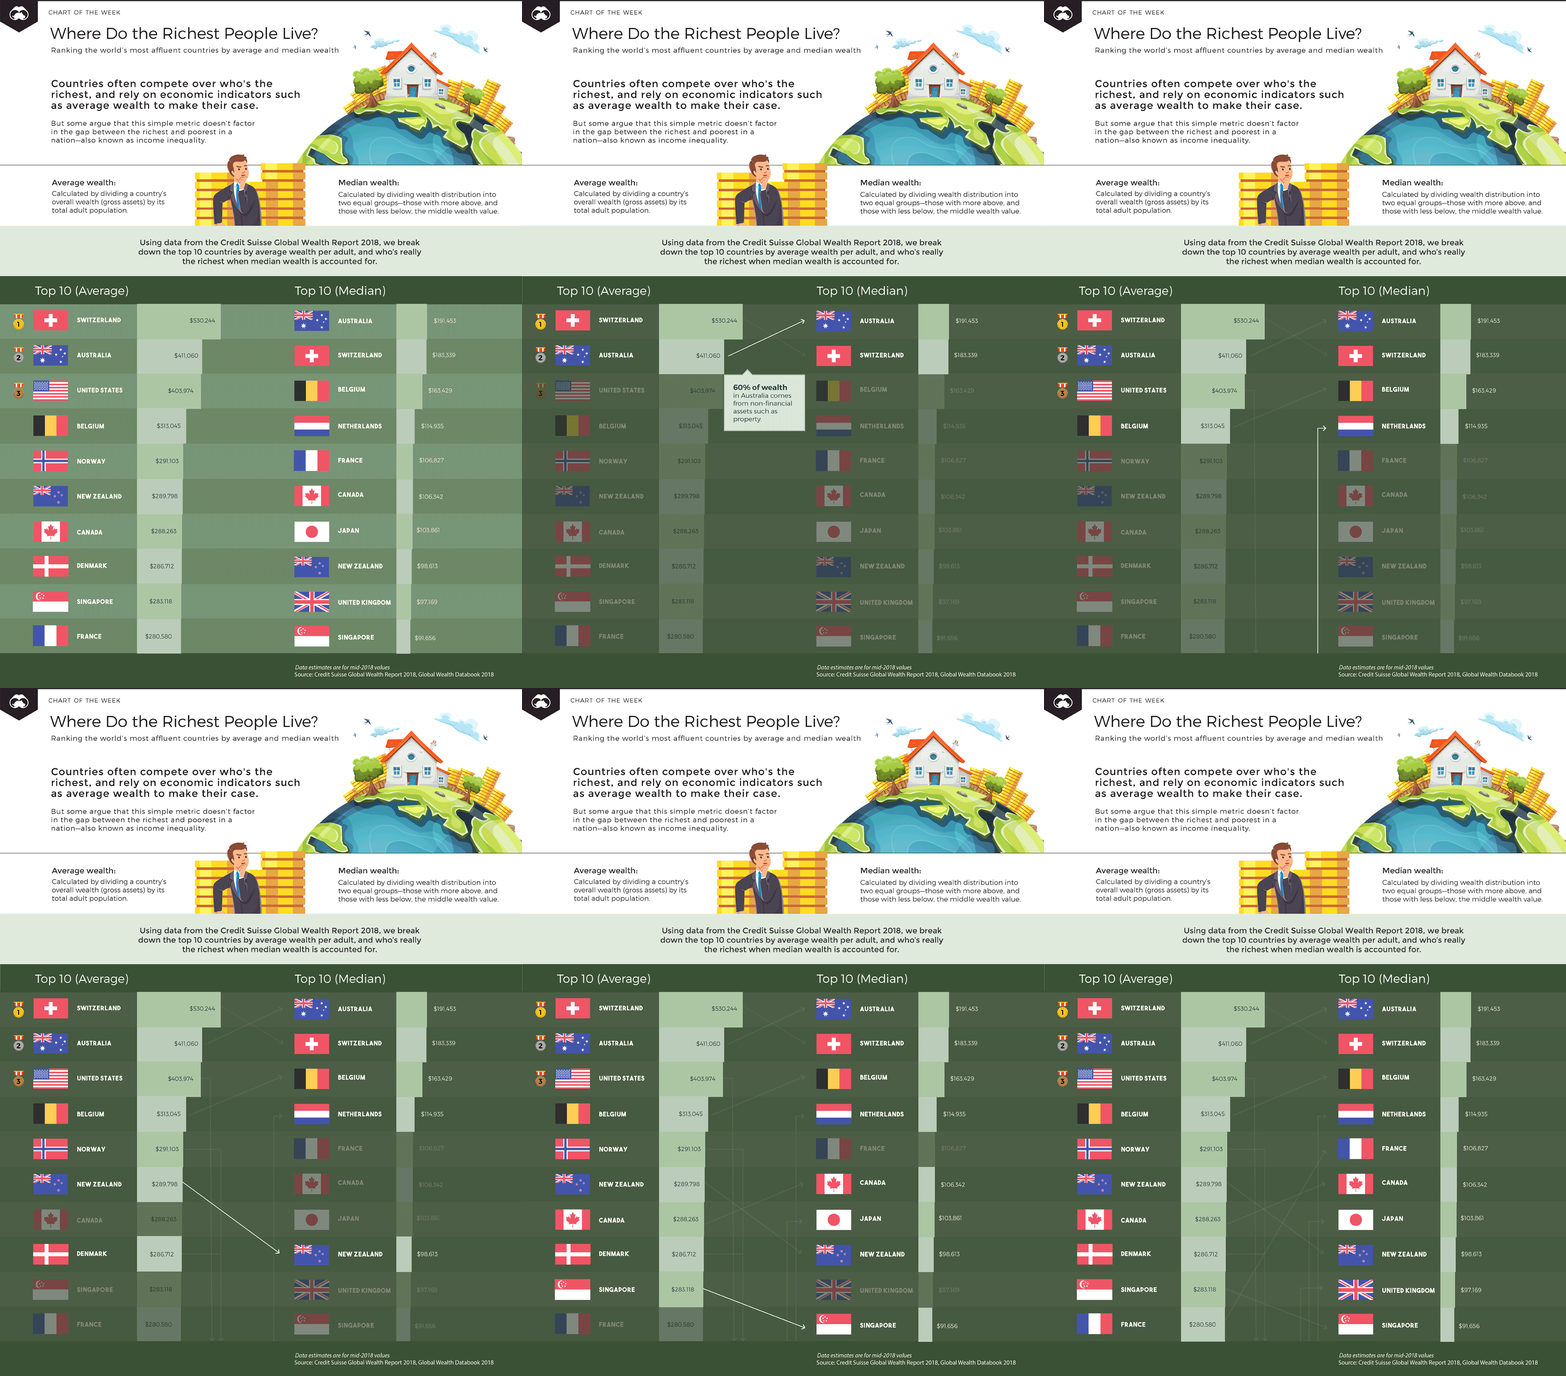
Which Countries Have the Most Wealth Per Capita? Data from the ninth Credit Suisse Global Wealth report
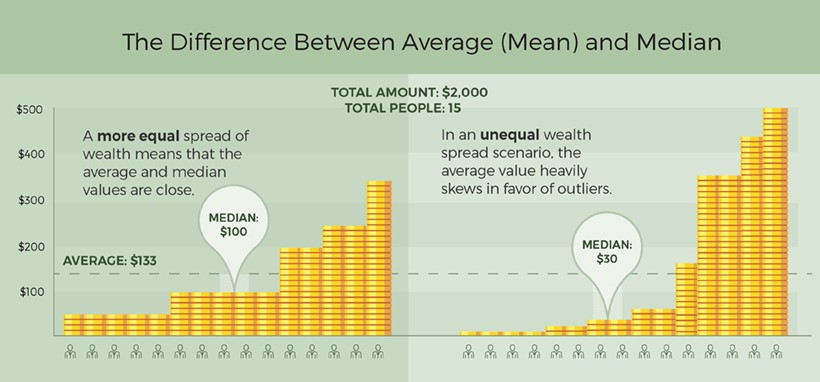
Ranking Top Contenders on Wealth per Capita
| Rank | Country | Mean wealth per adult | Country | Median wealth per adult |
| #1 | Switzerland | $530,244 | Australia | $191,453 |
| #2 | Australia | $411,060 | Switzerland | $183,339 |
| #3 | United States | $403,974 | Belgium | $163,429 |
| #4 | Belgium | $313,045 | Netherlands | $114,935 |
| #5 | Norway | $291,103 | France | $106,827 |
| #6 | New Zealand | $289,798 | Canada | $106,342 |
| #7 | Canada | $288,263 | Japan | $103,861 |
| #8 | Denmark | $286,712 | New Zealand | $98,613 |
| #9 | Singapore | $283,118 | United Kingdom | $97,169 |
| #10 | France | $280,580 | Singapore | $91,656 |
| #11 | United Kingdom | $279,048 | Spain | $87,188 |
| #12 | Netherlands | $253,205 | Norway | $80,054 |
| #13 | Sweden | $249,765 | Italy | $79,239 |
| #14 | Hong Kong | $244,672 | Taiwan | $78,177 |
| #15 | Ireland | $232,952 | Ireland | $72,473 |
| #16 | Austria | $231,368 | Austria | $70,074 |
| #17 | Japan | $227,235 | South Korea | $65,463 |
| #18 | Italy | $217,727 | United States | $61,667 |
| #19 | Germany | $214,893 | Denmark | $60,999 |
| #20 | Taiwan | $212,375 | Hong Kong | $58,905 |
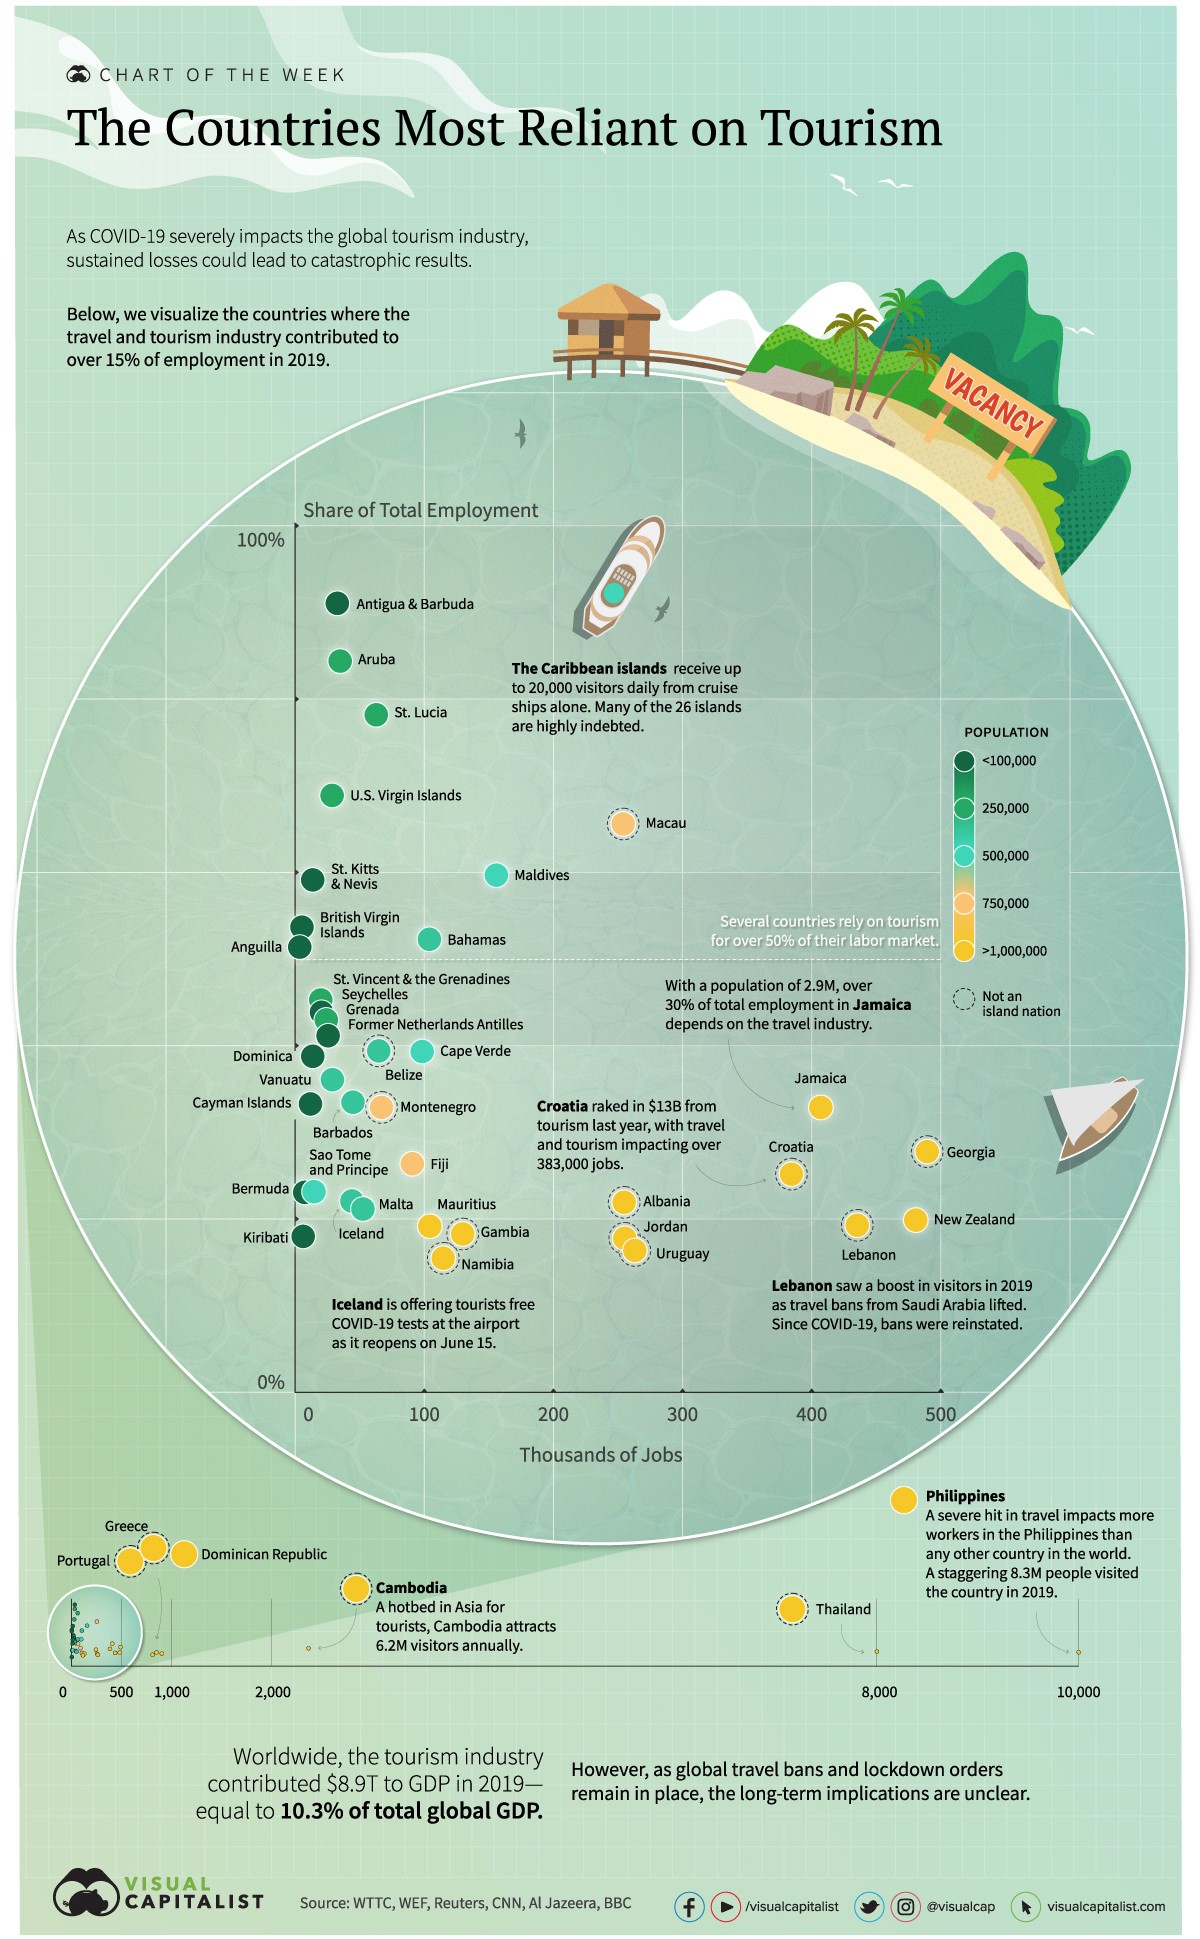
VISUALIZING THE COUNTRIES MOST RELIANT ON TOURISM PUBLISHED MAY 22, 2020
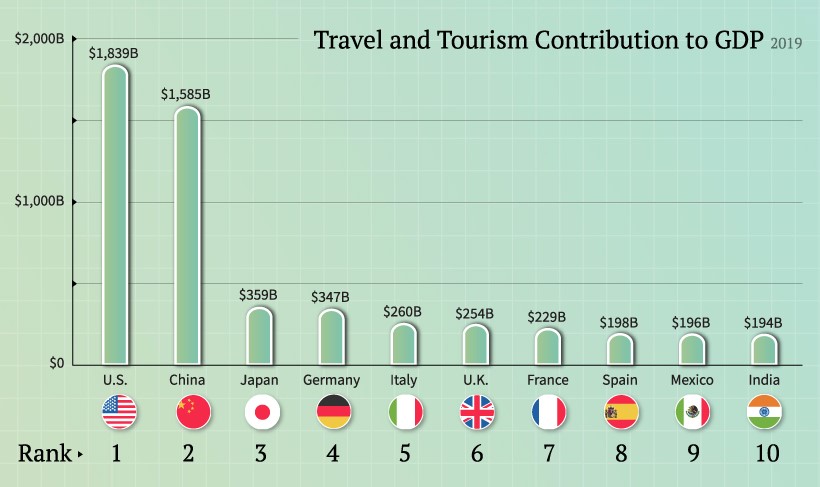
| Rank | Country | Travel and Tourism, Contribution to GDP |
| 1 | Mexico | 15.5% |
| 2 | Spain | 14.3% |
| 3 | Italy | 13.0% |
| 4 | Turkey | 11.3% |
| 5 | China | 11.3% |
| 6 | Australia | 10.8% |
| 7 | Saudi Arabia | 9.5% |
| 8 | Germany | 9.1% |
| 9 | United Kingdom | 9.0% |
| 10 | U.S. | 8.6% |
RANKED: THE MOST VALUABLE NATION BRANDS IN 2020 PUBLISHED DECEMBER 16, 2020
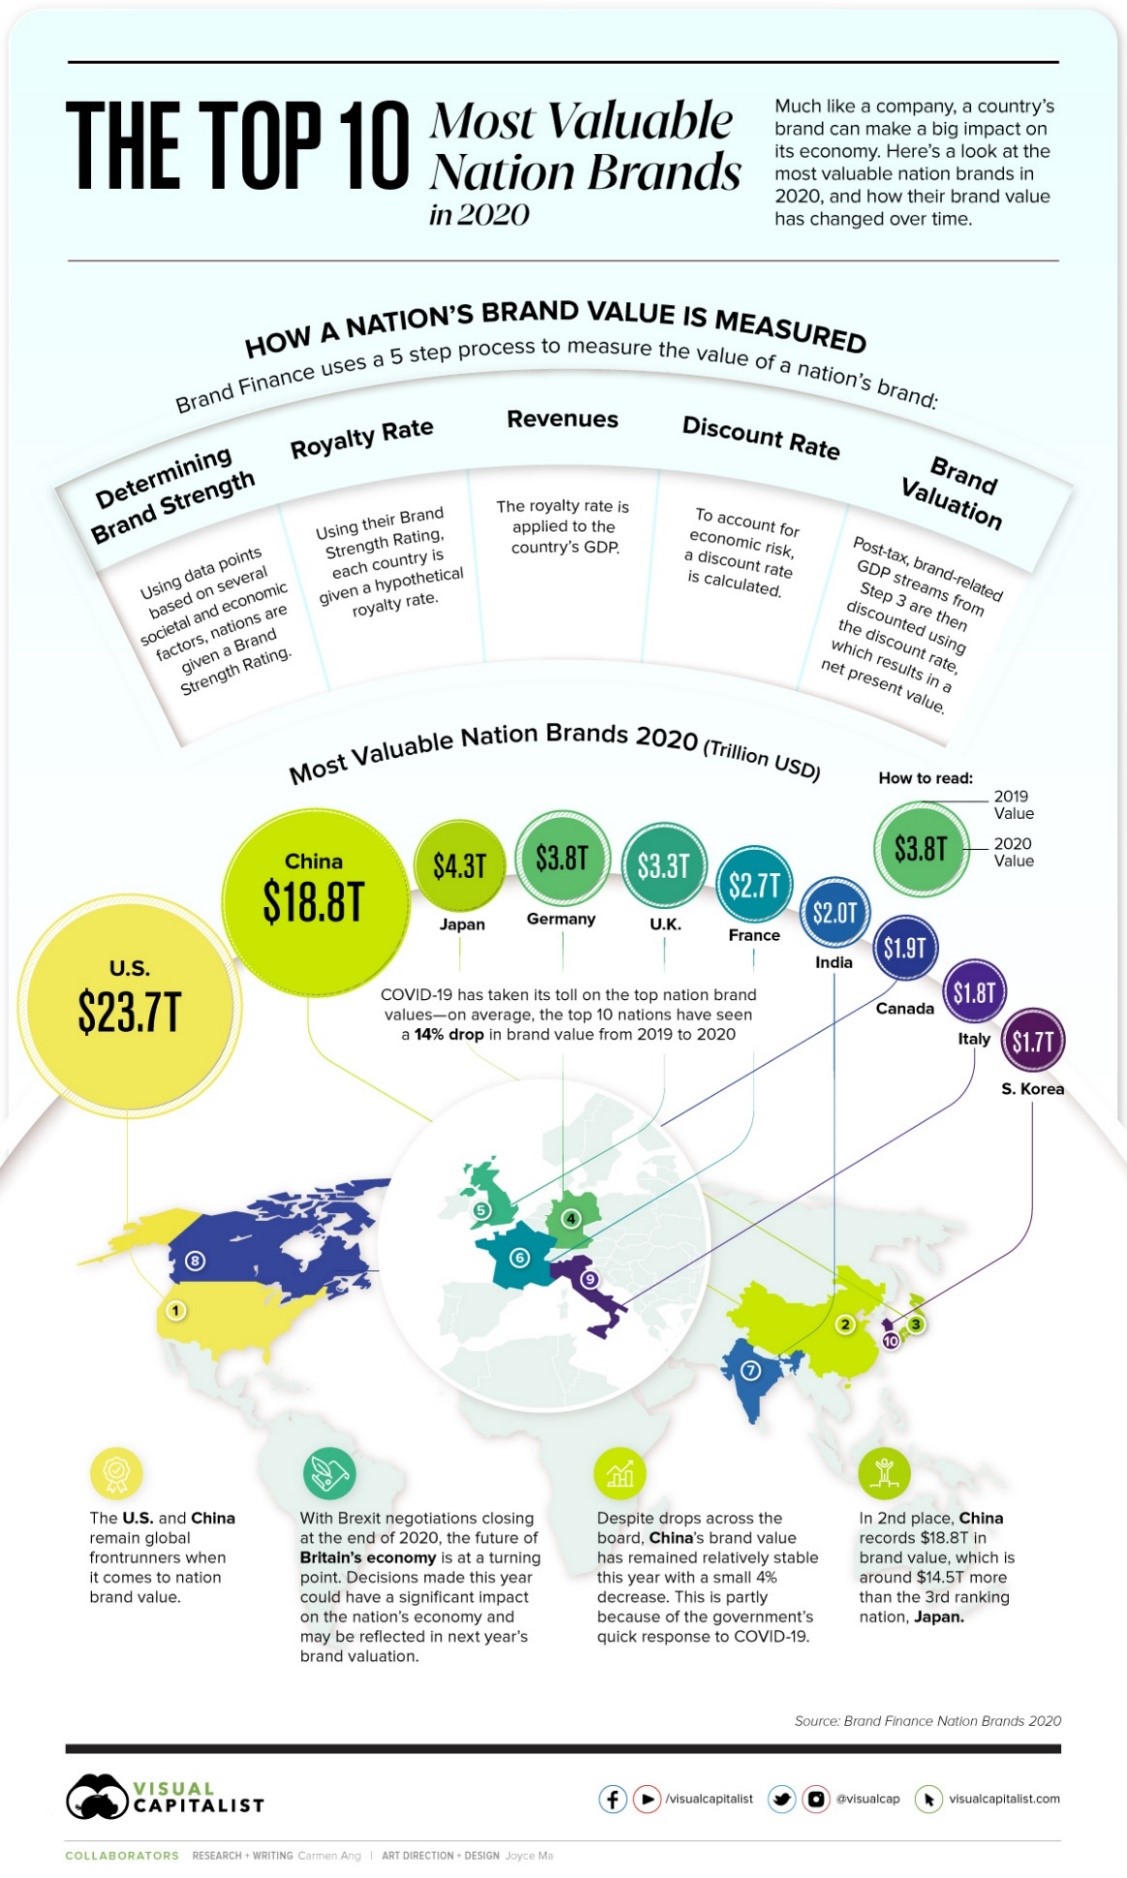
| Rank | Country | 2020 Value (USD, $T) | Change since 2019 |
| 1 | United States | $23.7 | -14.5% |
| 2 | China | $18.8 | -3.7% |
| 3 | Japan | $4.3 | -6.0% |
| 4 | Germany | $3.8 | -21.5% |
| 5 | United Kingdom | $3.3 | -13.9% |
| 6 | France | $2.7 | -12.8% |
| 7 | India | $2.0 | -20.8% |
| 8 | Canada | $1.9 | -13.0% |
| 9 | Italy | $1.8 | -15.8% |
| 10 | South Korea | $1.7 | -20.6% |
MAPPED: THE GREENEST COUNTRIES IN THE WORLD FEBRUARY 25, 2021
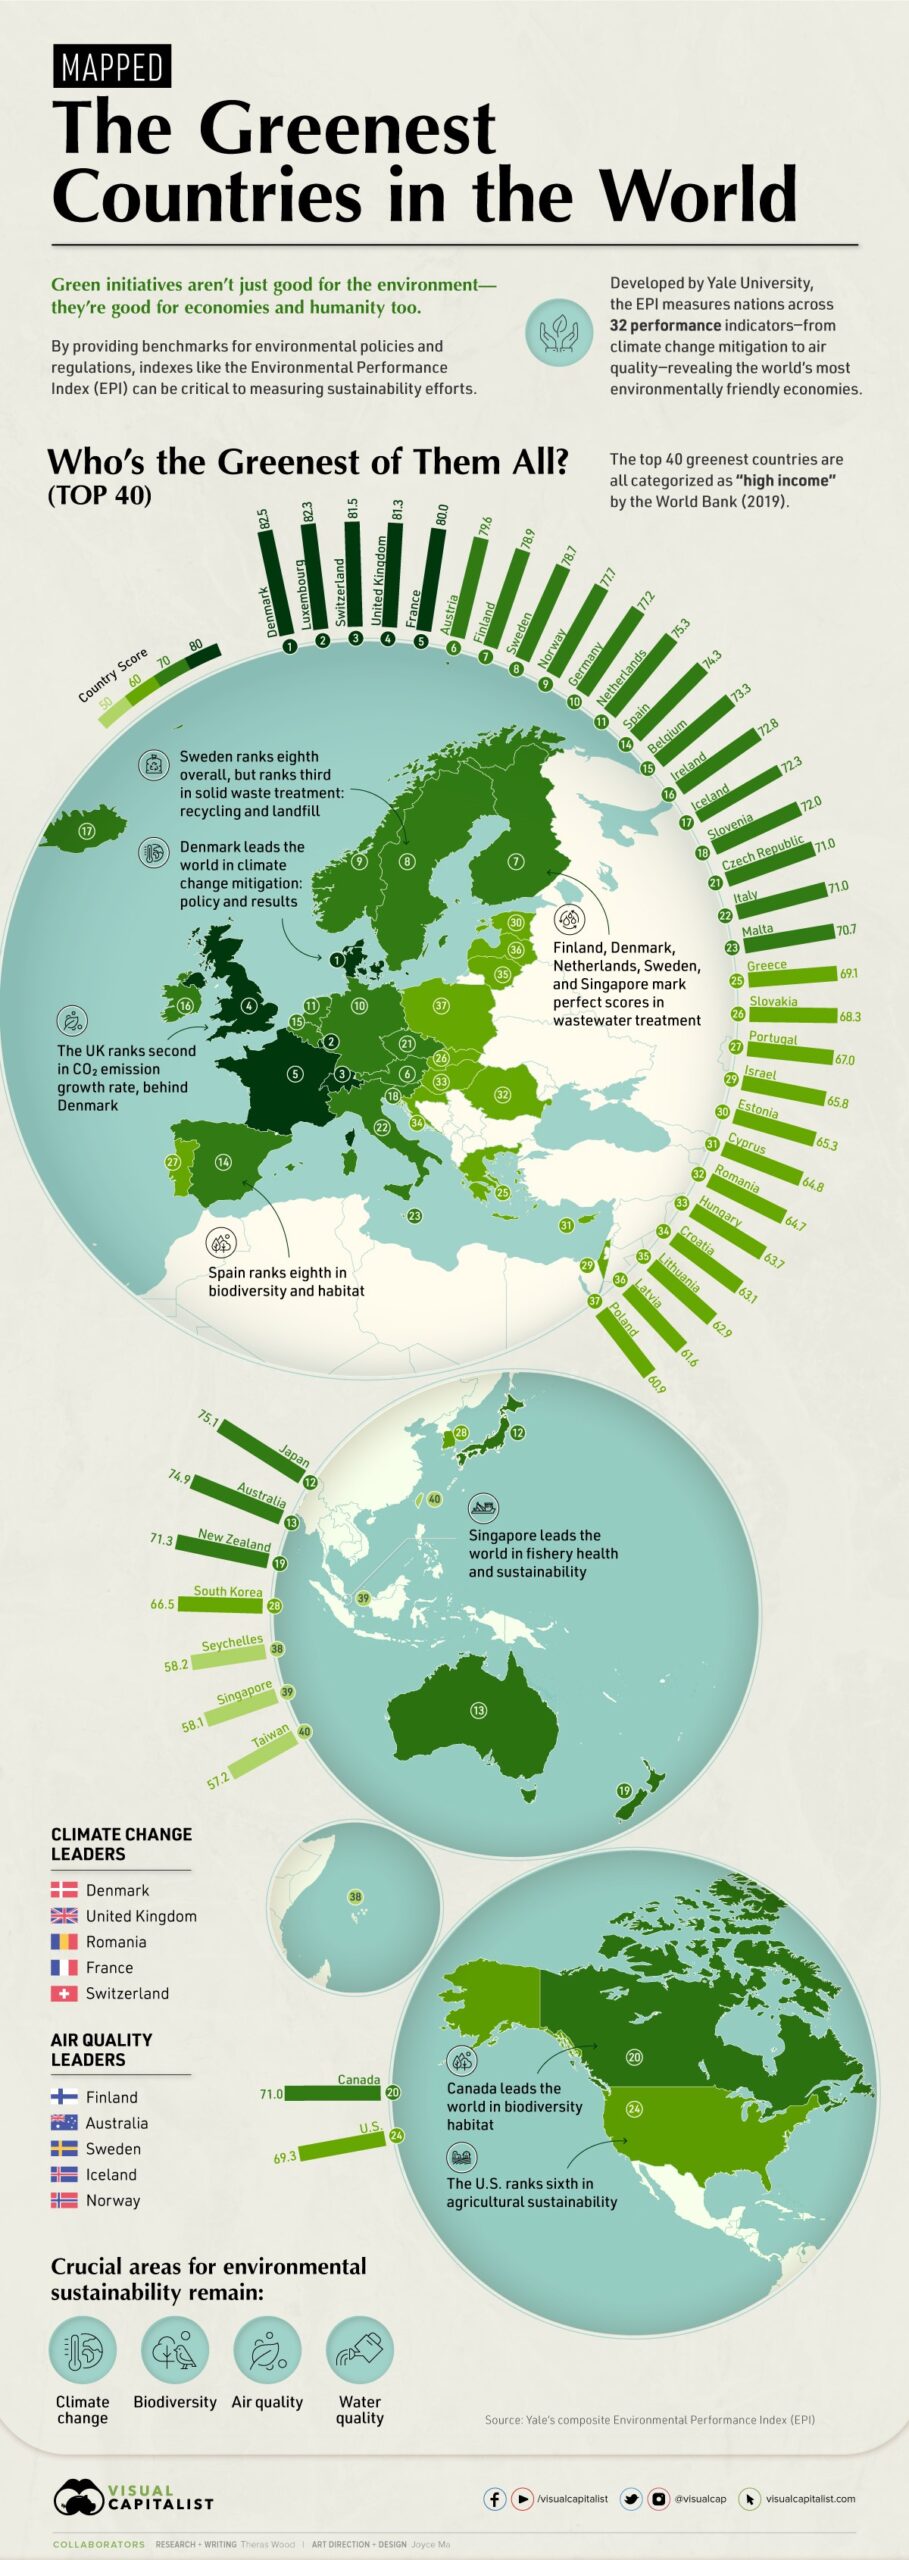
Mapped: The Greenest Countries in the World By EPI Score, the Yale’s Environmental Performance Index (EPI)
| OVERALL RANK | COUNTRY | SCORE | REGIONAL RANK |
| 1 | Denmark | 82.5 | 1 |
| 2 | Luxembourg | 82.3 | 2 |
| 3 | Switzerland | 81.5 | 3 |
| 4 | United Kingdom | 81.3 | 4 |
| 5 | France | 80 | 5 |
| 6 | Austria | 79.6 | 6 |
| 7 | Finland | 78.9 | 7 |
| 8 | Sweden | 78.7 | 8 |
| 9 | Norway | 77.7 | 9 |
| 10 | Germany | 77.2 | 10 |
| 11 | Netherlands | 75.3 | 11 |
| 12 | Japan | 75.1 | 1 |
| 13 | Australia | 74.9 | 12 |
| 14 | Spain | 74.3 | 13 |
| 15 | Belgium | 73.3 | 14 |
| 16 | Ireland | 72.8 | 15 |
| 17 | Iceland | 72.3 | 16 |
| 18 | Slovenia | 72 | 1 |
| 19 | New Zealand | 71.3 | 17 |
| 20 | Canada | 71 | 18 |
| 21 | Czech Republic | 71 | 2 |
| 22 | Italy | 71 | 18 |
| 23 | Malta | 70.7 | 20 |
| 24 | United States of America | 69.3 | 21 |
| 25 | Greece | 69.1 | 3 |
| 26 | Slovakia | 68.3 | 4 |
| 27 | Portugal | 67 | 22 |
| 28 | South Korea | 66.5 | 2 |
| 29 | Israel | 65.8 | 1 |
| 30 | Estonia | 65.3 | 5 |
COMPARING GDP PER CAPITA TO EPI SCORE
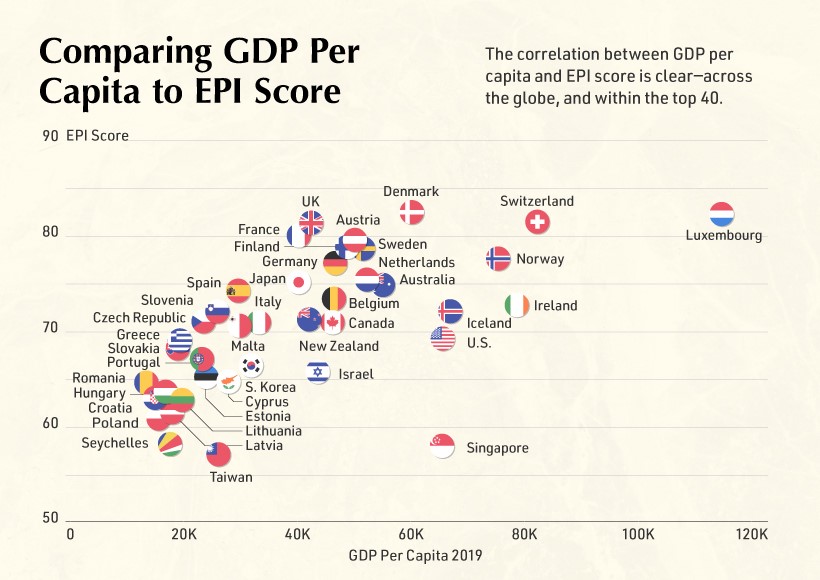
| COUNTRY | EPI SCORE | GDP Per Capita | RANK |
| Denmark | 82.5 | 60,170 | 1 |
| Luxembourg | 82.3 | 114,705 | 2 |
| Switzerland | 81.5 | 81,994 | 3 |
| United Kingdom | 81.3 | 42,330 | 4 |
| France | 80 | 40,494 | 5 |
| Austria | 79.6 | 50,138 | 6 |
| Finland | 78.9 | 48,783 | 7 |
| Sweden | 78.7 | 51,615 | 8 |
| Norway | 77.7 | 75,420 | 9 |
| Germany | 77.2 | 46,445 | 10 |
| Netherlands | 75.3 | 52,331 | 11 |
| Japan | 75.1 | 40,247 | 12 |
| Australia | 74.9 | 55,060 | 13 |
| Spain | 74.3 | 29,600 | 14 |
| Belgium | 73.3 | 46,421 | 15 |
| Ireland | 72.8 | 78,661 | 16 |
| Iceland | 72.3 | 66,945 | 17 |
| Slovenia | 72 | 25,946 | 18 |
| New Zealand | 71.3 | 42,084 | 19 |
| Italy | 71 | 33,228 | 22 |
| Czech Republic | 71 | 23,495 | 21 |
| Canada | 71 | 46,195 | 20 |
| Malta | 70.7 | 29,821 | 23 |
| United States of America | 69.3 | 65,298 | 24 |
| Greece | 69.1 | 19,583 | 25 |
| Slovakia | 68.3 | 19,266 | 26 |
| Portugal | 67 | 23,252 | 27 |
| South Korea | 66.5 | 31,846 | 28 |
| Israel | 65.8 | 43,592 | 29 |
| Estonia | 65.3 | 23,723 | 30 |
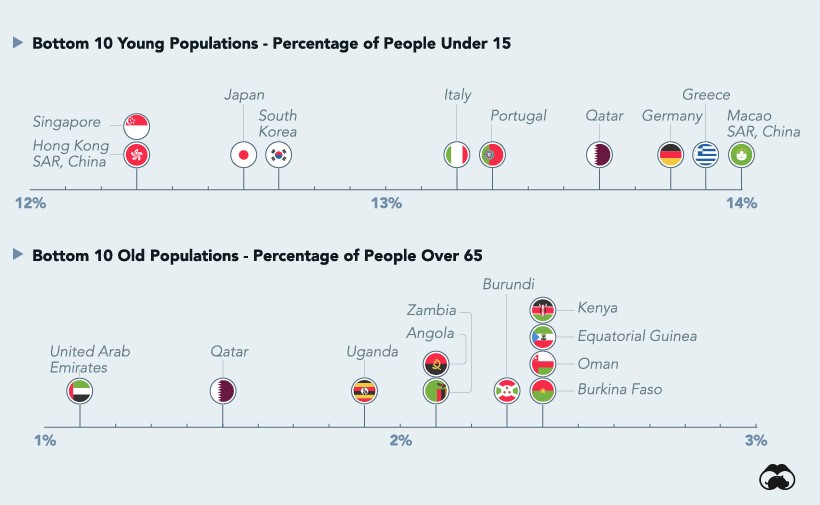
MAPPING THE WORLD’S YOUNGEST AND OLDEST COUNTRIES PUBLISHED FEBRUARY 12, 2021
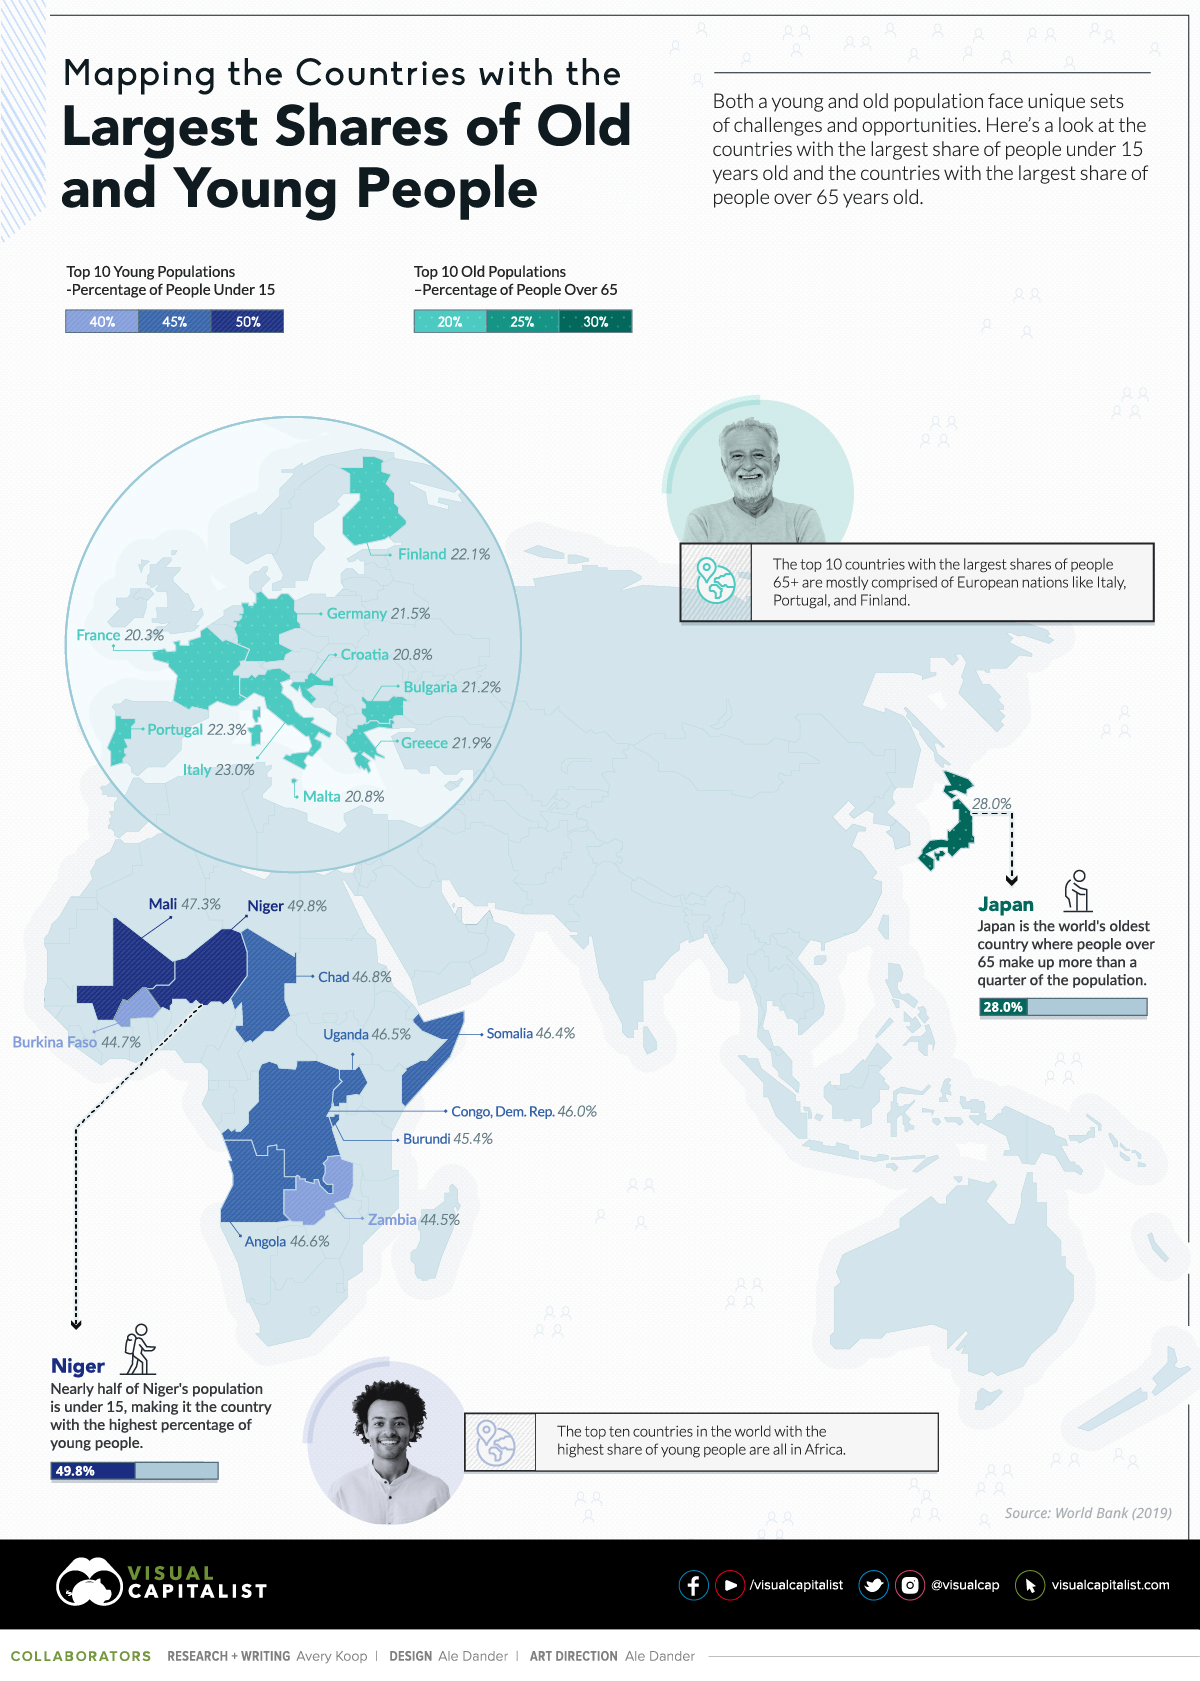
| Country | Share of Population Younger Than 15 (% of total, 2019) |
| Niger | 49.8% |
| Mali | 47.3% |
| Chad | 46.8% |
| Angola | 46.6% |
| Uganda | 46.5% |
| Somalia | 46.4% |
| Congo, Dem. Rep. | 46.0% |
| Burundi | 45.4% |
| Burkina Faso | 44.7% |
| Zambia | 44.5% |
| Country | Share of Population Older Than 65 (% of total, 2019) |
| Japan | 28.0% |
| Italy | 23.0% |
| Portugal | 22.4% |
| Finland | 22.1% |
| Greece | 21.9% |
| Germany | 21.5% |
| Bulgaria | 21.2% |
| Croatia | 20.8% |
| Malta | 20.8% |
| France | 20.3% |
